PhytoSense
Making Sense of
Plant Measurements
Plant Measurements
New
| PhytoClipDigital transformation: transform raw digital PhytoClip data. | |
| Integrations: PhytoSense v2 push integration. |
Improved
| Time shift for 30MHz push integration. |
Fixed
| Autoscale Y-axis checkbox has returned to the device plot display settings. | |
| Notification label 'Setup named' not hidden by default. | |
| Duplicated devices not showing up in the device list. | |
| Day/night zones not showing up on a newly created plot when being enabled. |
New
| HRM transformation: a wound diameter of 0 results in no wound correction. | |
| Pulse compression: support for a second sap flow pulse compression model. |
Fixed
| MacOS Big Sur Compatibility. |
New
| New 'Time Shift' transformation: shift any channel forwards or backwards in time. Great for calculations incorporating past values (in combination with the Equation transformation). | |
| New 'Diameter Variation Statistics +' transformation: also calculate daily gain and loss integrals with respect to the growth line. | |
| New 'Pulse Compression' transformation: compress sap flow pulses using a pulse compression model. | |
| New 'Pulse Decompression' transformation: decompress compressed sap flow pulses into standard temperature measurements. | |
| Dynagage transformation: delayed calculations of 1 hour when data gaps > 30 minutes are detected. | |
| HRM transformation: specify temperature ratio period start and duration. | |
| HRM transformation: calculate sap flow directly from compressed pulse data. | |
| PhytoClip transformation: calculation error values: (-10: failed to autodetect sensor serial number, -20: no sensor connected, -30: bad temperature, -40: not within calibration range (too small), -50: not within calibration range (too large)). | |
| Notifications: make any notification an administrator notification (for administrator users only). All administrator users will be notified when such a notification is triggered. | |
| Notifications: new 'Particle log' and 'Integration log' notifications (for administrator users only). Get server log messages for Particle devices and Integrations. | |
| Notifications: new 'Device type' notification. Triggered when a certain channel of ANY device of this type meets the trigger criteria. | |
| Dashboard graph curve context menu shortcuts to switch Y-axis and enable/disable curve line, symbol and fill (right click on curve legend item). | |
| 5 new curve symbols: Plus, Cross, Star 1, Star 2 and Hexagon. | |
| Day/night zones on dashboard graphs (based on the location and time zone of the setup: Settings > Setup). |
Changed
| PhytoClip transformation: temperature and calibration coefficients are now autodetected continuously (not only when the transformation is created). | |
| Default dashboard graph curve symbol and fill colour is now identical to the line colour (for new curves). | |
| Opacity of the default dashboard graph curve fill colour is now 25% (for new curves). |
Fixed
| When selecting graph curve colours, the colour selection dialog now stays on top. | |
| Always keep the navigation bar scroll bar visible (Mac fix, use together with System Preferences > General > Show scroll bars > Always). |
New
| Transformations: PhytoClip transformation | |
| Integrations: 30MHz push and pull integration | |
| Integrations: DeltaLINK Cloud pull integration | |
| User permissions: allows pasting text in the 'scope column' to select an item from the drop down menu |
Changed
| Exported values now respect the system settings for the decimal symbol (. or ,) |
Fixed
| Problem not showing 'add transformation' button when users have setup write permissions | |
| Problem with missing data while exporting |
New
| Integrations: push or pull data to and from external webservices | |
| In-app support requests (if enabled for your account) |
Changed
| Permission changes to allow users with setup write permissions to add new transformations and change data mappings | |
| Dynagage Ksh interval start time can now be negative (e.g. -4 is 20:00 the previous day) | |
| The Particle configuration edit button is moved to below the list of Particle devices | |
| Improved application load time | |
| Usernames with spaces are no longer permitted |
Fixed
| Fixed a problem with the font size of combobox permission and data mapping items | |
| Reduced the device transformation dialog box height | |
| Fixed bug in search for data mappings |
New
| Improved application and setup load time | |
| Sorting, search and filtering throughout the application | |
| Setups can be duplicated | |
| Setups can have a location (latitude, longitude, altitude) | |
| Start date/time of a setup can now be changed | |
| Devices can have a location (latitude, longitude, altitude) | |
| Dynagage transformation: a fixed Ksh can now be specified | |
| Plant types can be specified | |
| Plants with attached devices can be added to setups | |
| Plant properties: type, location, height, length | |
| Clear warnings when devices and plants are used in multiple setups | |
| Support for Particle devices (last contact, configurations, commands, log) | |
| Easily switch between Particle device and corresponding data mapping | |
| Show last data and last contact data/time for data mappings |
Changed
| Account names are now shown as: [organisation full name] ([username]) | |
| Add existing device: link | |
| Add existing device: duplicate device (no data, no transformations) | |
| Add existing device: duplicate device and data (no transformations) | |
| Add existing device: duplicate device and transformations (no data) | |
| Add existing device: duplicate device, data and transformations | |
| Dynagage transformation: use minimum value instead of average in Ksh interval |
Fixed
| Fixed problem with device transformation data not updating on dashboard graphs | |
| Lists in the setup settings dialog now respond to up and down key presses | |
| The selected item in the main navigation bar is now being remembered when editing the setup settings | |
| Problem with Dynagage transformation when no useful channels are available | |
| Warning when closing the data mapping editing dialog | |
| Fixed problem with passwords containing percentage characters | |
| Some GUI elements now resize according to their text content | |
| Various other GUI fixes |
New
| All data on dashboard graphs can now be exported (button in upper right corner of the graph) | |
| Device transformation 'Filter': automatically remove values above or below a certain threshold | |
| Account list is now sorted | |
| Added a 'Remove' button to the dashboards drop down menu | |
| Location on the dashboard is now remembered when switching dashboards | |
| Last used setup for each account is now remembered | |
| Added support for sensor node commands |
Changed
| More robust data fetching mechanism |
Fixed
| Account switching problem for accounts located on different servers | |
| Years with system preferences YY are now accepted as 20XX instead of 19XX |
New
| Model support: visualize results from online simulated and calibrated models (any PhytoSim model can now run in PhytoSense) | |
| Device transformation 'Diameter Variation Correction': autocorrect diameter variation signals (removes sudden jumps) | |
| Device transformation 'Diameter Variation Statistics': automatically calculate daily growth and maximum daily shrinkage |
Changed
| HRM probe spacing and wound diameter can now take any value | |
| Shared dashboards can only be renamed when they are unlocked | |
| More details on what 'Channel' means in the equation of the tooltip of an equation transformation |
Fixed
| Fixed a problem with the tooltips of combined devices | |
| Fixed problems with graphs not showing data despite it being there | |
| Fixed a problem with the time controls when switching between setups |
New
| Toolbar button to reload the data of the currently visible graphs | |
| Multiple dashboards (click the Add button on the Dashboards > Shared or Dashboards > Private navigation bar item) | |
| Create combined devices which are combinations of channels of other devices | |
| Minimum and low flow check for Dynagage transformation | |
| Ability to specify a minimum interval between two transformation calculations | |
| About dialog (Help > About (Windows) or PhytoSense > About PhytoSense (Mac)) |
Changed
| Improved setup configuration system | |
| Setups are now sorted in the drop-down box |
Fixed
| Improved 'busy' cursor | |
| Fixed a problem where the export download dialog remained on the screen when cancelling the export | |
| Fixed a problem where the graph settings dialog would disappear behind the main window |
New
| Performance improvement: (detailed) data is only downloaded when it is needed for visualisation | |
| Notification system: get notified when data values breach certain thresholds | |
| Notification system: get notified when the data flow of a certain device is interrupted/restored | |
| Notification system: get notified about new server/gateway messages (admin users only) |
Changed
| Reworked the data export system to always download all the to-be-exported data first |
Fixed
| Selecting a device category in the 'Devices' section now shows an empty page |
New
| Device transformation 'Hrm': calculates heat pulse and sap velocities based on HRM (heat ratio method) temperature measurements | |
| Time control buttons to jump to the previous/next time interval (when Live mode is off) | |
| Gateway log messages can now be copied to the clipboard | |
| For admin users: Organisation server log messages | |
| For admin users: Database analytics | |
| For admin users: API analytics |
Changed
| Devices in the 'Devices' section are now organized according to their device category and sorted alphabetically | |
| Devices in the 'Sensor Network' section are now sorted alphabetically |
Fixed
| Fixed various issues with special character units like °C and % | |
| Dashboards no longer crash when transformations are plotted which have been removed | |
| Dashboard colour selection dialogs are no longer covered by the dashboard graph settings dialog | |
| Fixed a problem with duplicate curves when dragging newly created transformations to a dashboard graph |
New
| Dashboards with custom graphs (supporting channels and/or transformations from multiple devices on the same graph) | |
| One 'Shared' dashboard per setup: visible to all users with read acces to that setup. Users with write access to that setup can unlock and modify the dashboard. | |
| One 'Private' dashboard per setup: private for each user |
Fixed
| Permission problem caused by the device type channel unit validation |
New
| Plot settings | |
| Ability to add device transformations to any device for which you have write access | |
| Device transformations 'Average': calculates the average of the data values within a specified time window | |
| Device transformations 'Combine': combines data from several channels into one channel | |
| Device transformations 'Cumulate': cumulates the data values within a specified time window | |
| Device transformations 'Dynagage': calculates sap flow from raw Dynagage measurements | |
| Device transformations 'Equation': applies an arbitrary equation to all the data points of the selected channel | |
| Device transformations 'Integrate': calculates the surface below the curve between the data points within a specified time window | |
| Device transformations 'Maximum': determines the maximum value within a specified time window | |
| Device transformations 'Minimum': determines the minimum value within a specified time window | |
| Device transformations 'Moving Average': calculates a moving average of the data values within a specified time window | |
| Device transformations 'Remove': allows to remove parts of the selected channel data | |
| Device transformations 'Sum': calculates the total sum of the data values within a specified time window | |
| Real-time validation of device channel units | |
| Device channel ids are now shown in the tooltips on the navigation bar | |
| Sensors can now be directly attached to gateways | |
| 'Enable debug mode' gateway command: switch on debug mode for a limited duration |
Changed
| Live update interval is now set to 10 seconds | |
| Devices in a setup can now have the same name | |
| Improved data export accuracy |
Fixed
| Fixed problem with setup device renaming (false duplicates) | |
| Fixed a problem with the value inspector at the exact time of a measurement | |
| Fixed a problem with adding data to a new and empty device | |
| Switching accounts now also updates the status bar | |
| Fixed a graph clearing issue when no channels are present |
New
| Easier switching between accounts | |
| Value inspector slider |
Fixed
| Logout did not clear the setup selection box | |
| Exporting of single-channel data now works again |
New
| Setups |
Changed
| Devices no longer have an editable name |
Changed
| Admin users can now change their own permissions |
Fixed
| Fixed a problem with an incorrect begin and end date/time being set for devices without data | |
| Settings dialog is no longer 'empty' when it is opened for the first time |
Initial release
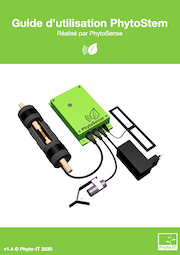
Download the latest version of thePhytoStem User Guide
English

Français
Download the latest version of thePhytoClip User Guide
English
Français

![]()
Phyto-IT BV
Krevelstraat 18 - bus 102
9000 Gent
Belgium
info@phyto-it.com
For all questions related to the PhytoSense Webservice product.
![]()
2Grow BV
Aelmeerstraat 5
9070 Destelbergen
Belgium
info@2grow.earth
For all questions related to the PhytoStem and PhytoClip products.


