PhytoSense Webservice
Collect, process and visualise all your sensor data
Use our API to send data from internet connected data loggers, servers, computers or custom hardware to our cloud service for storage and processing. Visualisation can be done using the PhytoSense software or your own custom application or website.


Organise your measurement devices in setups which are bound in space and time.
Use device templates to quickly add new devices to setups.
Within setups, devices are organised in categories and/or sensor networks.
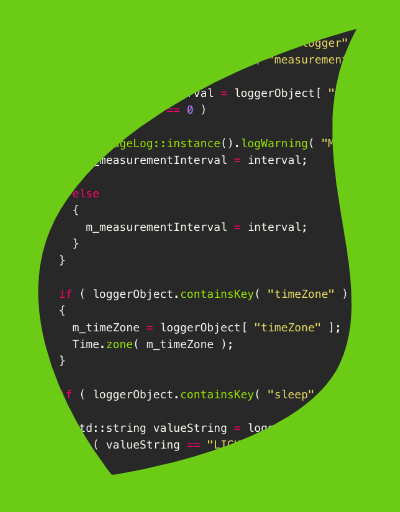
Use the powerful xml or json based API to add and extract data from the PhytoSense cloud service.
Any internet enabled device can connect to PhytoSense.
Use the API to build complete custom applications or websites.
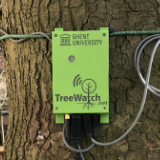
Treewatch.net tree monitoring network.

CITREE.net City Tree Citizen Science.
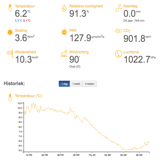
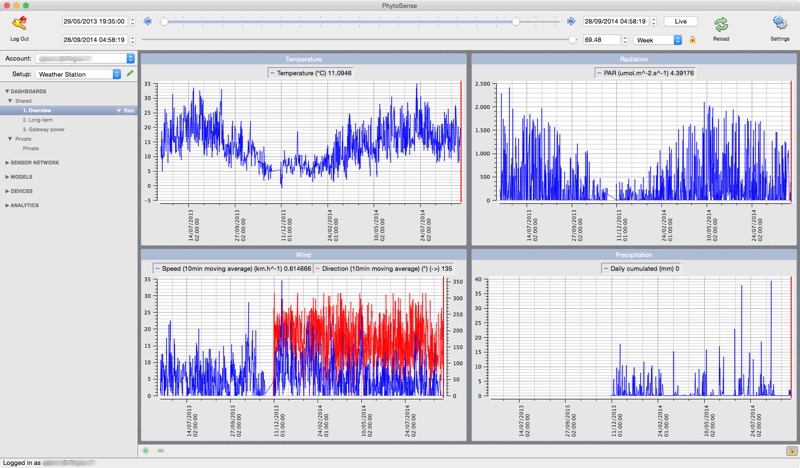
UGent Laboratory of Plant Ecology weather station website.
Average of the data values within a specified time window (e.g. 1 day for daily averages).
Moving average of the data values within a specified time window.
Total sum of the data values within a specified time window.
Cumulated data values within a specified time window.
Surface below the curve between the data points within a specified time window.
Minimum value within a specified time window.
Maximum value within a specified time window.
Applies an arbitrary equation to the data.
Removes parts of the data.
Filter out data based on thresholds.
Combines data from different sources into a single new timeline.
Transform raw PhytoClip measurements into temperature-corrected calibrated values.
Calculates sap flow from raw Dynagage measurements.
Calculates heat pulse and sap velocities from raw HRM temperature measurements.
Corrects diameter variation signals for sudden jumps in the signal.
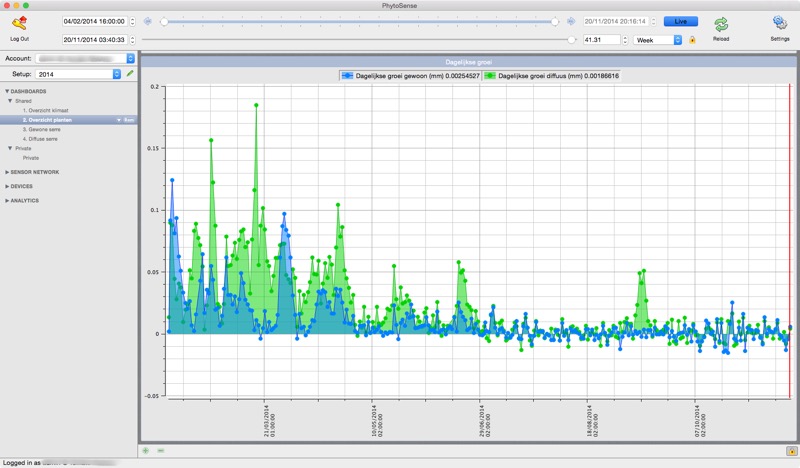
Calculates daily growth, maximum daily fluctuation and other statistics of diameter variation signals.
Create an unlimited number of users with different read and write permissions.
Users can be given access to one or more setups or even to a single measurement device.
Easily share part of your data with the world or with people external to your organisation.
Notifications can be generated when data is below or above a threshold for a specified amount of time. You can also get notified when a device is offline for a specified amount of time.
You can choose to get certain notifications directly or once a day (for less urgent things).
Notifications can be generated when PhytoSense generates error, warning, info and debug messages.
All PhytoSense data can be exported at all times.
A PhytoSense license allows you to store up to 160 GB of data which is approximately 7.200.000.000 or 7.2 billion data points!
You remain the owner of the data at all times. We will not sell your data.
PhytoSense can be accessed using our Mac or Windows desktop application. Web application coming soon.
Create dashboards with custom graphs to quickly view the data you are most interested in.
PhytoSense is able to efficiently handle large amounts of data and will only load and show details if required.